Working with logs is an essential part of testing, as it helps identify bottlenecks present in every web application. Kibana is used to simplify log analysis – it is open-source software designed for data visualization.
What is Kibana and how is this tool used in testing
- 21.09.2023
- Posted by: Admin

Kibana
Kibana is a visual interface tool that allows you to explore, visualize, and create dashboards over log data collected in Elasticsearch clusters.
Elastic, the company behind Kibana, also develops two other open-source tools – Elasticsearch and Logstash. Logstash is responsible for processing and sending logs, while Elasticsearch serves as a search engine, and visualization is accomplished through the Kibana web interface. These three tools can work well together and are widely known as the ELK Stack or Elastic Stack. Testers are provided with access to the configured system through a link, which can be opened in any web browser.
Today, Elastic Stack is successfully used by services such as Netflix, Volkswagen, eBay, Uber, Adobe, Microsoft, Nvidia, GitHub, Amazon, and more.
The main function of Kibana is data querying and analysis. In addition, Kibana's features allow for data visualization using heat maps, line charts, histograms, pie charts, and geospatial support. Various methods can be used to search for diagnostic data stored in Elasticsearch.
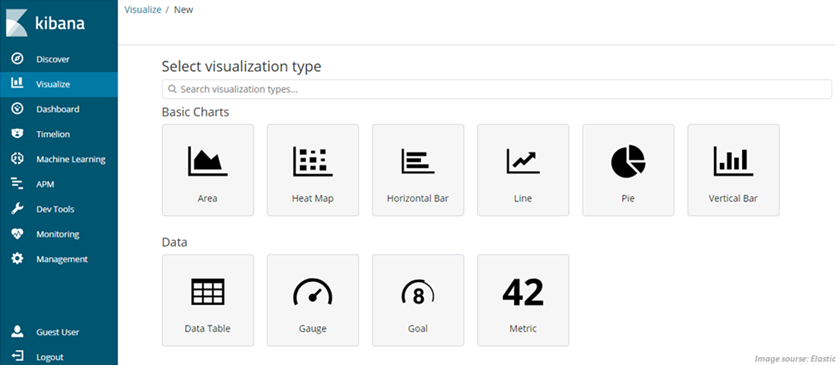
With Kibana, it becomes easier to understand large volumes of data, and you can quickly create and publish dynamic monitoring dashboards that reflect changes in Elasticsearch queries in real-time. This visualization tool has various options on the left panel, as shown below:
The «Discover» page provides interactive data exploration. You can set a time filter, send search queries, view document data, and filter search results.
«Visualize». Kibana offers a wide variety of visualization styles. The screenshot shows the visualization page, where you can combine pie charts, data tables, line charts, single metric visualization, time series, geographical maps, and more.
«Dashboards». This page displays a collection of visualizations and searches. You can filter data and open a dashboard in full-page mode. The customizable dashboard feature allows you to resize, arrange, and modify the dashboard content and save it so that you can share your dashboard.
«Timelion» analyzes and visualizes time series data using simple expression language. This functionality is designed to bring together the completely independent data sources within a single interface. It offers a way to define queries, visualization, and transformation in one place.
The complexity and extensions of datasets make it difficult to identify cyber-attacks, infrastructure issues, and business problems. However, the Kibana’s machine learning page intends to create anomaly detection jobs and observe results. This feature automatically models the behavior of the Elasticsearch data, including periodicity & trends and spot issues faster thereby reducing false positives.
«Machine Learning». The Kibana’s machine learning page intends to create and display results of anomaly detection jobs for cyberattacks, infrastructure issues, and business problems.
«APM». The application performance monitoring system allows users to control their applications and collects performance metrics and errors. This enables developers to check program performance data and identify bottlenecks.
«Dev Tools». Kibana developer tools interact with the Elastic Stack. As it includes Console that supports developers to write Elasticsearch commands in one tab and view those commands in a different tab.
«Monitoring». On the Kibana monitoring page, you can:
- visualize data across Elastic Stack as it includes options to monitor the performance data for Elasticsearch, Kibana, Logstash as well as Beats in real-time;
- analyze the past performance of these products;
- ensure deep monitoring of Kibana.
«Management». The management page of Kibana is used for performing Kibana’s runtime configuration, which includes three vital options:
- index pattern – supports for initial setup & ongoing configuration of index names;
- saved objects – hosts the saved visualization, dashboards, and searches;
- advanced settings for Kibana.
Some advantages of Kibana include:
- intuitive Kibana diagrams and reports;
- launching popular queries, histograms, and more with just two clicks;
- detecting anomalies in hidden data;
- secure access to dashboards, protection against data leaks;
- various methods for searching log data;
- visualization of geospatial data on maps;
- automated visualization reports using HTTP POST requests.
Kibana's drawbacks include:
- issues that arise for different product versions, such as the time spent on adding plugins.
Data visualization helps users discover patterns, monitor environments, and take action when abnormal behavior is detected. Currently, there is a vast list of data visualization tools on the market that provide the visual clarity needed for understanding and analyzing data, and we have discussed one of the most popular ones.


