Let's imagine that you are the only tester on the project and your company has a contract to develop a web application available worldwide. Hundreds of thousands are expected to access the website at the same time. In this case, performance will play a big role, because the servers need to process user actions efficiently. Therefore, you need to know how the web servers will perform under such a load. You, as a tester, need to provide results for such a scenario. In this case, it is necessary to use load-testing tools that can simulate user behavior in real-time. JMeter is one of the tools that can help to perform this kind of testing.
Using JMeter in testing
- 21.02.2024
- Posted by: Admin

Apache JMeter
Apache JMeter is a tool for load testing and performance verification developed by the Apache Software Foundation. It provides virtual user authorization mechanisms, supports user sessions, logs test results, and provides various visualizations of results in the form of charts, tables, etc.
Apache JMeter is a Java-based, open-source tool with an architecture that supports third-party plug-ins, which allows you to add new features to the tool. While originally it was designed to test web applications, it has since expanded to other testing functions.
Currently, JMeter supports the following protocols:
- web – HTTP, HTTPS sites web 1.0, web 2.0 (ajax, flex та flex-ws-amf);
- web-services – SOAP / XML-RPC;
- Databases through drivers JDBC;
- Reference – LDAP;
- JMS messaging service;
- services – POP3, IMAP, SMTP;
- FTP service.
What types of testing can be performed by using the JMeter tool?
- Performance testing – it sets the highest possible performance expectation for a given infrastructure configuration. At the beginning of the testing process, users are notified of the need to make any changes before launching the program.
- Load testing – it is mostly used to test the system under the maximum load for which it was designed.
- Stress testing – the meaning of this testing is to break the system by overloading its resources.
- Recovery testing – how quickly will the server recover and what will happen to the data if the server goes down.
Some of JMeter's features and advantages:
- It is a widely available software with open-source code.
- It has a simple and intuitive graphical interface.
- It is a platform-independent tool. You can launch JMeter on Linux/Unix by clicking on the JMeter shell script. On Windows, it can be launched by opening the jmeter.bat file.
- It provides full support for Swing and simplified components (the precompiled JAR uses packages javax.swing. *).
- JMeter saves test plans in XML format. This means that one can create a test plan using a text editor.
- Its full multithreaded structure supports simultaneous sampling by many threads and simultaneous sampling of different functions by separate groups of threads.
- You can also use it for automated and functional testing.
- JMeter is well supported by an online community and has training manuals.
JMeter installation
The installation process is quite simple.
- Check the system requirements. You will need one of the following programs to run JMeter: Oracle Java or OpenJDK, therefore, you should make sure that the current version of Java is installed on the system. To check the presence of Java and its version, enter java -version at the command line. It is also recommended to use the latest version of JMeter as the software is constantly being improved and updated.
- Download and install Jmeter. Select the «Download Releases» link in the «Download» section on the left side of the page on the Apache JMeter website. Choose one of the archive formats from JMeter binary files or JMeter source files to start the download. After downloading the file, unzip and extract the file to a folder on your computer.
- Start JMeter. To do this, go to the folder that contains the JMeter directory. Select the /bin folder. Find and select the jmeter.bat file. Wait for the start of the interface loading (GUI mode). As soon as the download is finished, you can start creating a test plan.
Keep in mind that JMeter can be run in three different modes:
- GUI mode: used for building test scripts and debugging;
- Command Line Interface (CLI) mode: used mostly for load testing;
- Server mode: used for distributed load testing on remote nodes.
This article specifically covers how to launch and use JMeter version 5.6.2 in GUI mode.
How to create a load test in JMeter.
To do this, after launching JMeter, the first thing to do is to create a test plan.
The Test Plan is a sequence of components that specify how the load will be emulated.
The main components will be discussed below.
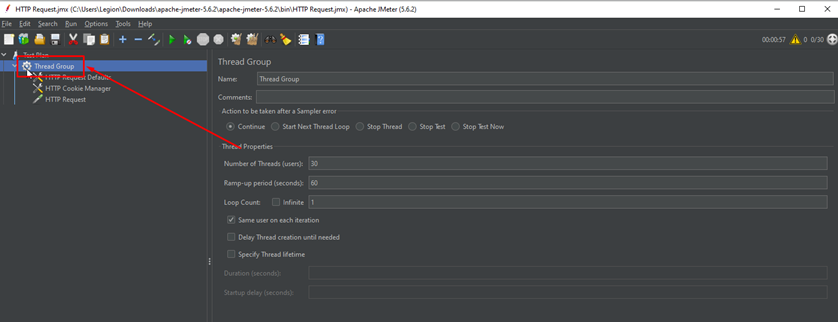
First, you need to add a Thread Group to the test plan. Thread groups have three especially important parameters which influence load testing:
- Number of Threads (users): The number of threads (users) that JMeter will emulate. Or in other words, the number of users that will attack the resource.
- Ramp-Up Period (in seconds): The duration of the test in seconds, or the time it takes for Jmeter to launch the specified number of users.
- Loop Count: The number of tests or, more specifically, the number of requests made by a user.
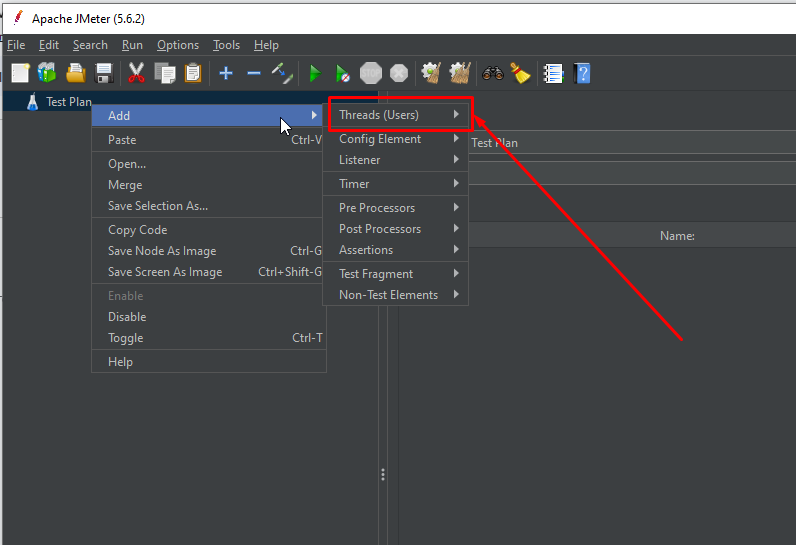
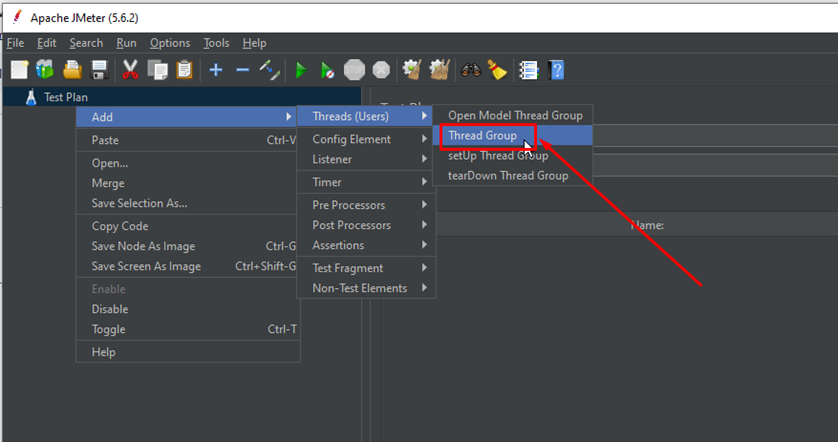
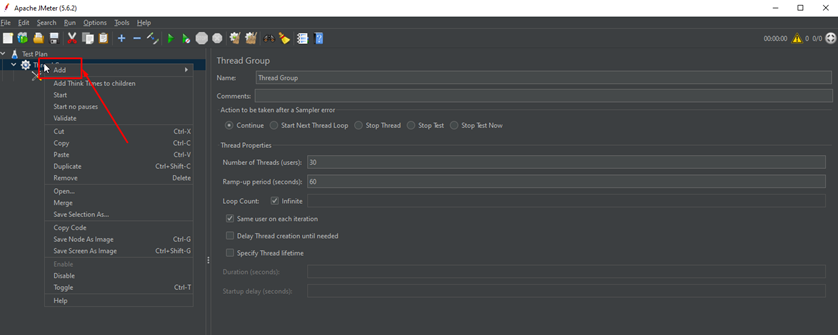
To add a thread group, it is necessary to:
- right-click on the «Test Plan» line;
- hover the cursor over the «Add» drop-down list;
- select the «Threads (Users)» drop-down list;
- select the «Thread Group» value;
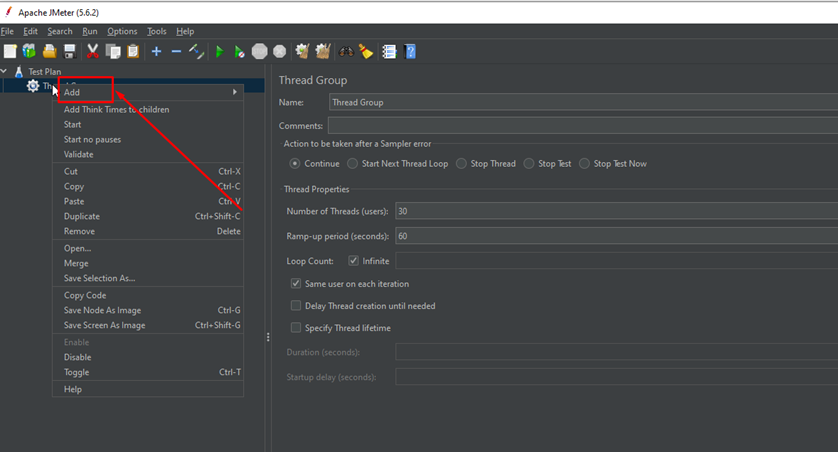
- set the above parameters in the window that appears: «Number of Threads», «Ramp-Up Period» and «Loop Count»;
- optionally, you can add the name of the thread group and comments to the specific test plan in the «Comments» field.
For example, the following parameter values are selected: Threads – 30, Ramp-up – 60, Loop-Count – Infinite.
Then, HTTP needs to be configured. The HTTP Request Defaults element is used to set the default values of HTTP requests in this test plan.
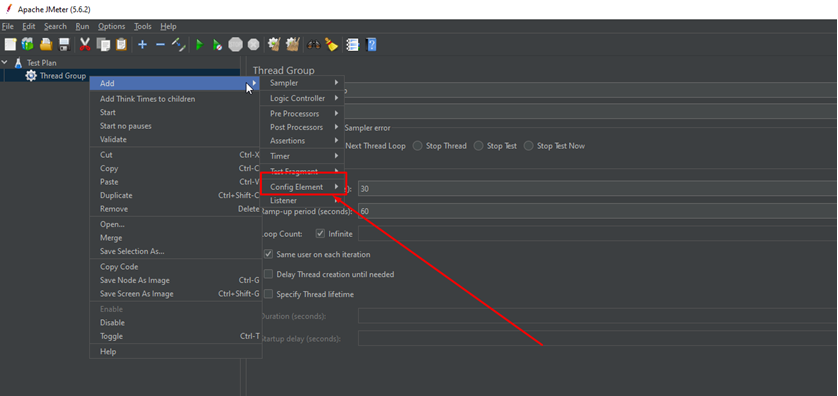
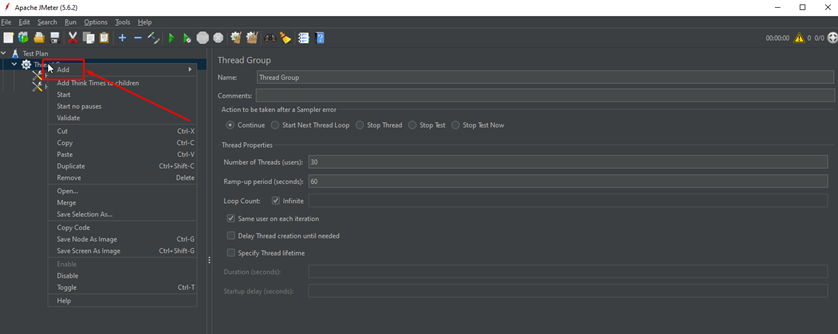
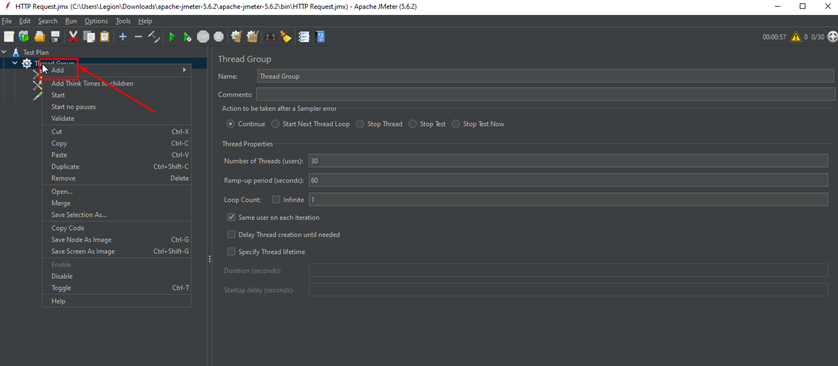
Add HTTP settings for the Thread Group:
- right-click on the «Thread Group»;
- hover the cursor over the «Add» drop-down list;
- select the «Config Element» drop-down list;
- select the «HTTP Request Defaults» value;
- specify the name or IP address of the web server under test in the «Web Server» section in the «Server Name or IP» field.
The server set here then becomes the default server for other elements of this thread group.
For example, let's take the www.google.com website for testing.
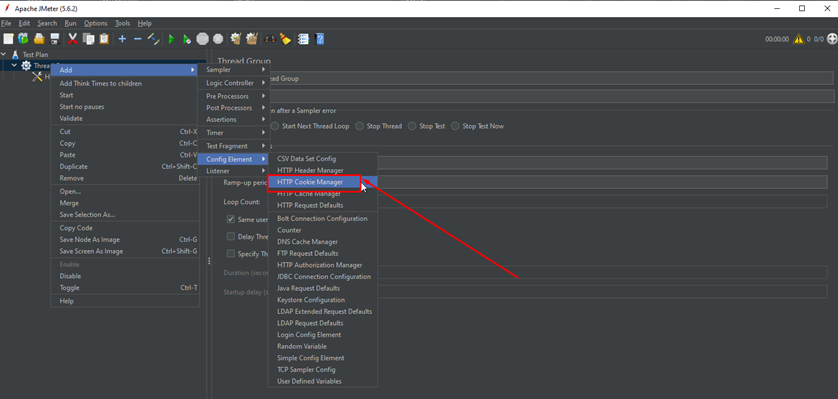
Next, let's configure the HTTP Cookie Manager. If the server uses cookies, their support is configured using the HTTP Cookie Manager element.
Adding HTTP Cookie Manager settings for the Thread Group:
- right-click on the «Thread Group»;
- hover the cursor over the «Add» drop-down list;
- select the «Config Element» drop-down list;
- select the «HTTP Cookie Manager» value;
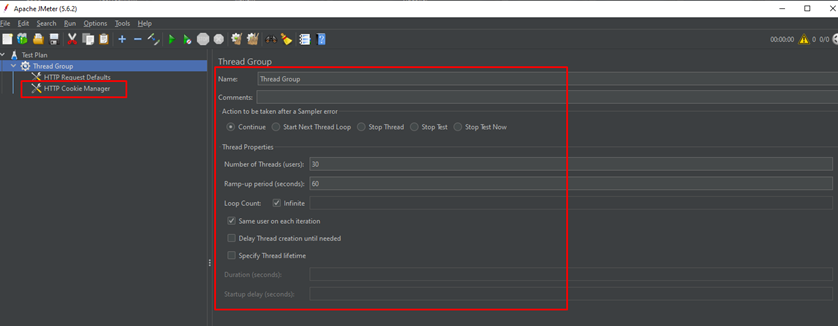
After performing these steps, the following screen will appear and the HTTP Cookie Manager configuration will be added to the test plan tree.
This component allows storing virtual user cookies and sending them to the server just like a regular browser does. HTTP Cookie Manager should be used when the tested website stores information about the user's session in cookies.
Now let's configure the samplers. The HTTP Request component which represents the page requests of each thread is responsible for setting up the HTTP request sampler.
Samplers are actual requests to the server. For example, HTTP samples are used for testing website load, application, or API. Other samples include FTP, SMTP, Java, JDBC, and SOAP requests.
Adding an HTTP request sampler
- right-click on the «Thread Group»;
- hover the cursor over the «Add» drop-down list;
- select the «Sampler» drop-down list;
- select the «HTTP Request» value;
- specify the object to which all users should send the request in the «HTTP Request» section in the «Path» line.
For all users to send requests to the home page, it is necessary to set the value «/» in the «Path» line. Remember that you do not need to specify the server, as it is already specified in the «HTTP Request Defaults». To add more HTTP Requests to the test, you need to repeat the steps above.
For example, let's test the Google Maps service. In the Path line, the «/maps» value is specified.
In addition, you can add other HTTP sampler settings in this window:
- add the name of the sample HTTP request in the «Name» field. Optionally, you can add a comment for this sample in the «Comments» field.
- set the request type. By default, the type is set to «GET», but it can also be changed to another type (POST, HEAD, PUT, PATCH, etc.).
Once you have completed the configuration of the thread group, HTTP, and samplers, the test is ready to run. Now you need to save the test plan by clicking «File» on the top panel and selecting «Save Test Plan as».
Test results
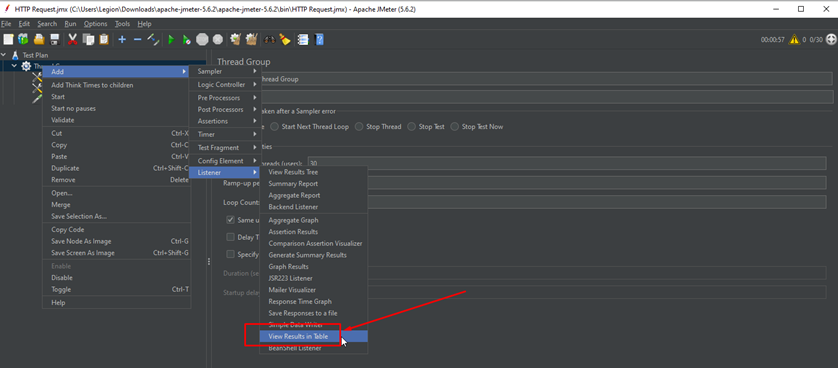
To display load test results, you need to use JMeter plugins called listeners. There are many available plugins. In the following example, we will use the table. To install this plugin, you need to:
- right-click on the «Thread Group»;
- hover the cursor over the «Add» drop-down list;
- select the «Listener» drop-down list;
- select «View Results in Table»;
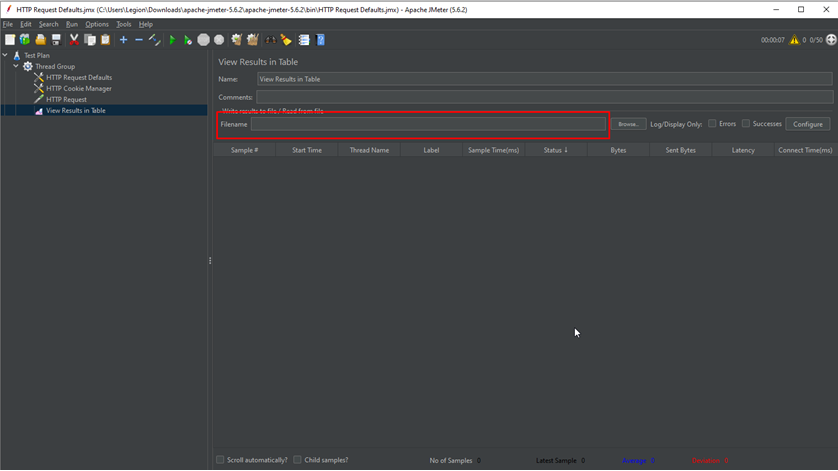
The new «View Results in Table» option will appear in the tree on the left, and the following window will open by clicking on it:
In this window, it is also possible to set the «Filename» value to save the output to a CSV file.
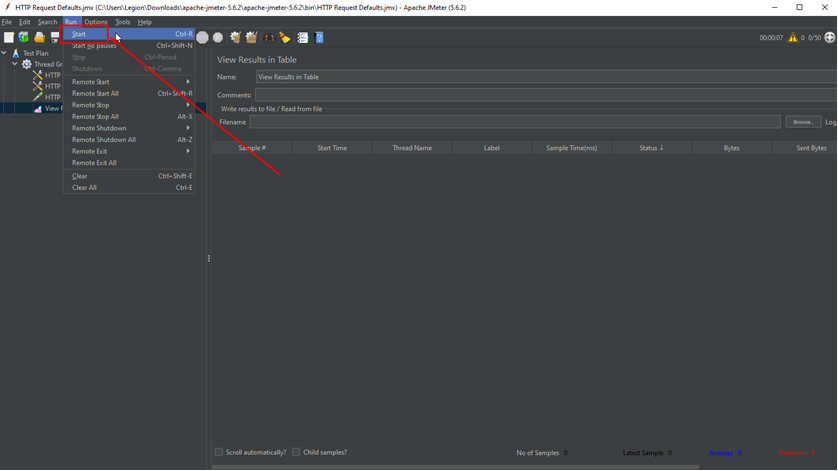
Now the basic plan is ready and you can start load testing and view the result. To do this, click on the «Run» in the upper panel of the main menu and select «Start» (or you can simply click on the green «Start» arrow below the main menu).
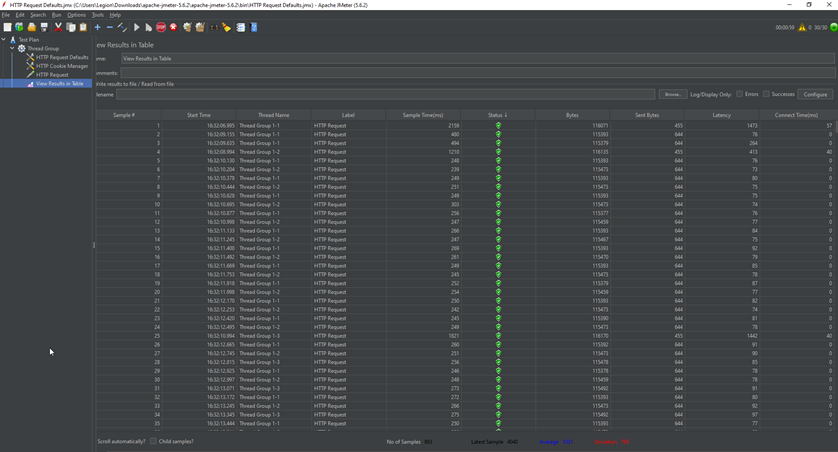
The test results will appear in the form of a table.
The following metrics will be displayed in the table.
- Start time: the start time of each thread.
- Thread Name: the name of the thread for each run and user.
- Sample Time (ms): the time interval in milliseconds that it takes for the server to fully process the request (response + waiting time).
- Status: A green check mark means that all requests were completed successfully, a red check mark indicates a failure.
- Latency: The time interval in milliseconds between sending a request and receiving a response.
Additional metrics are also included, such as Bytes, Sent Bytes, Label, and Connect Time(ms).
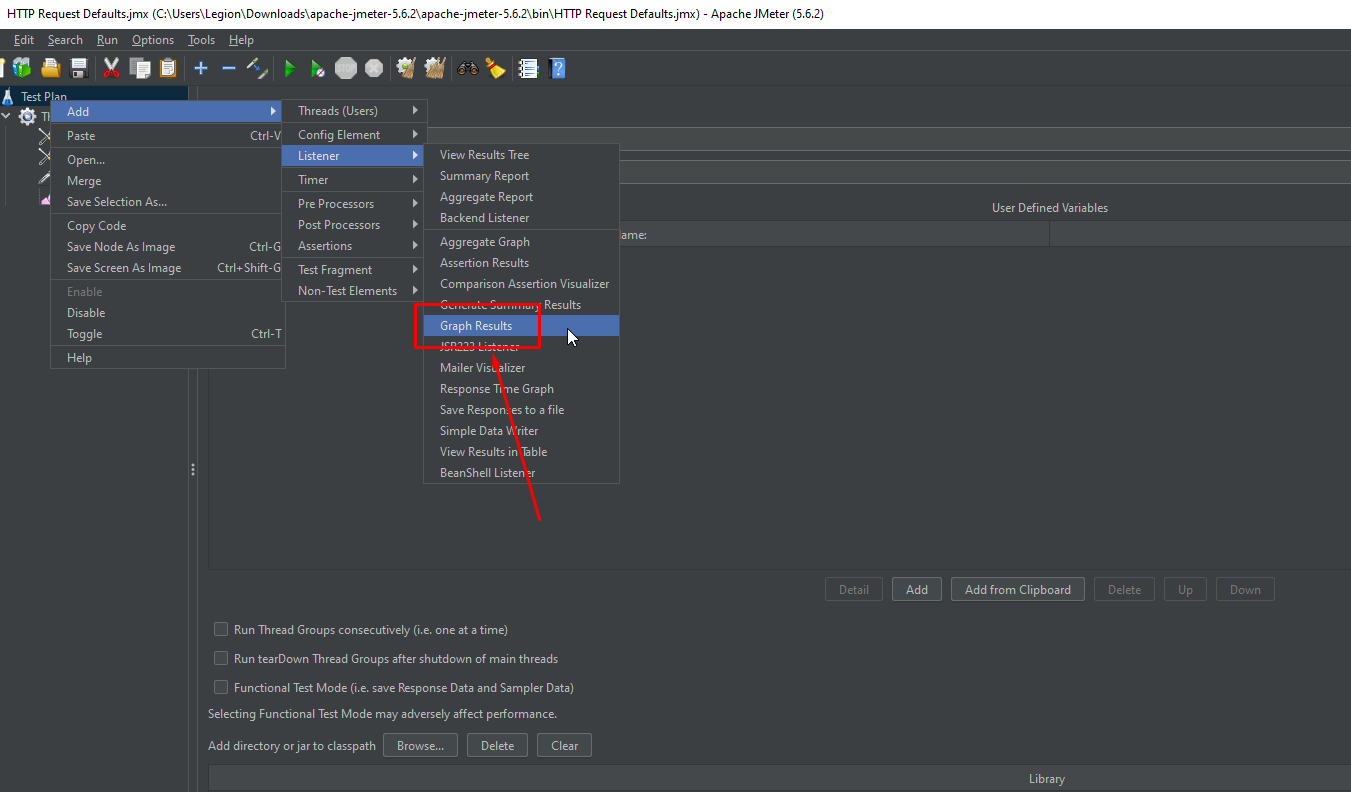
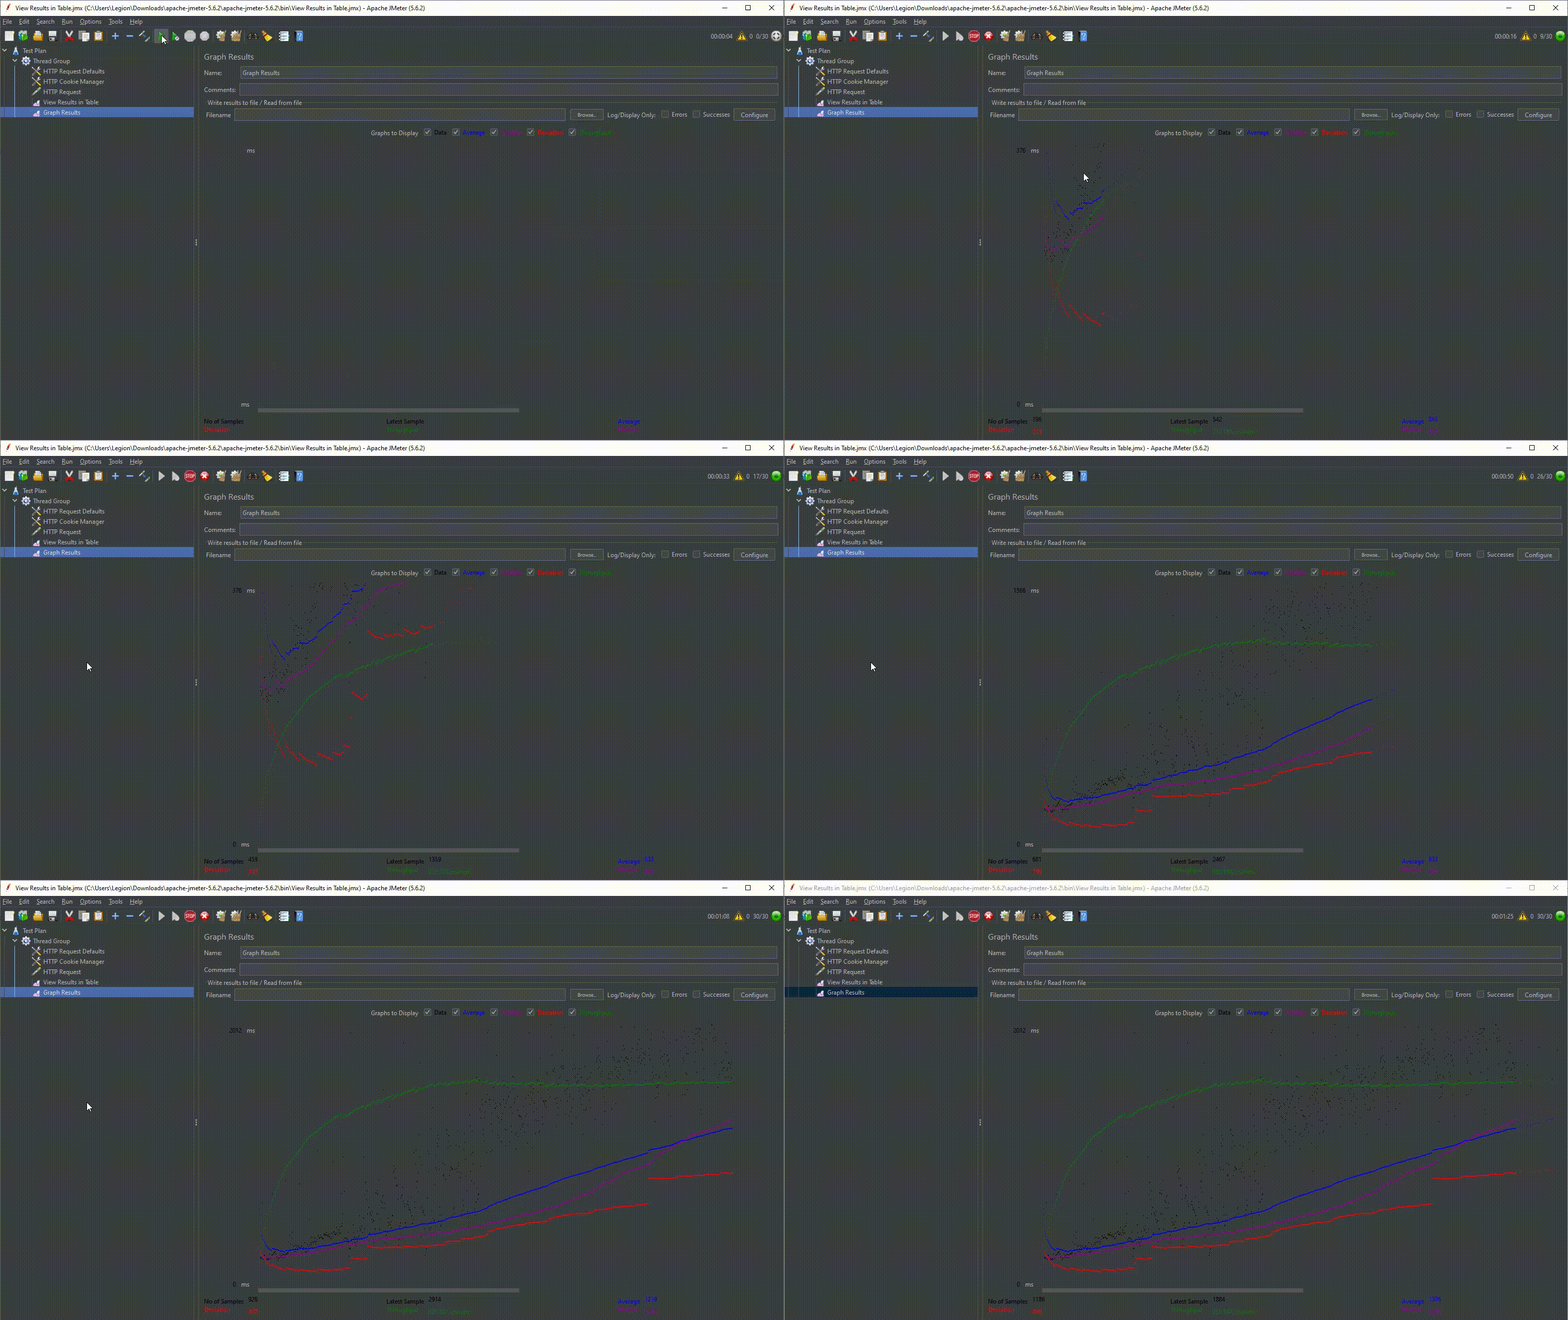
One more method of displaying test results is graphical. It shows the test result on a graph in real-time. To use this method of display, you need to follow the same steps as for table one but select «Graph Results» in the «Listener» drop-down list.
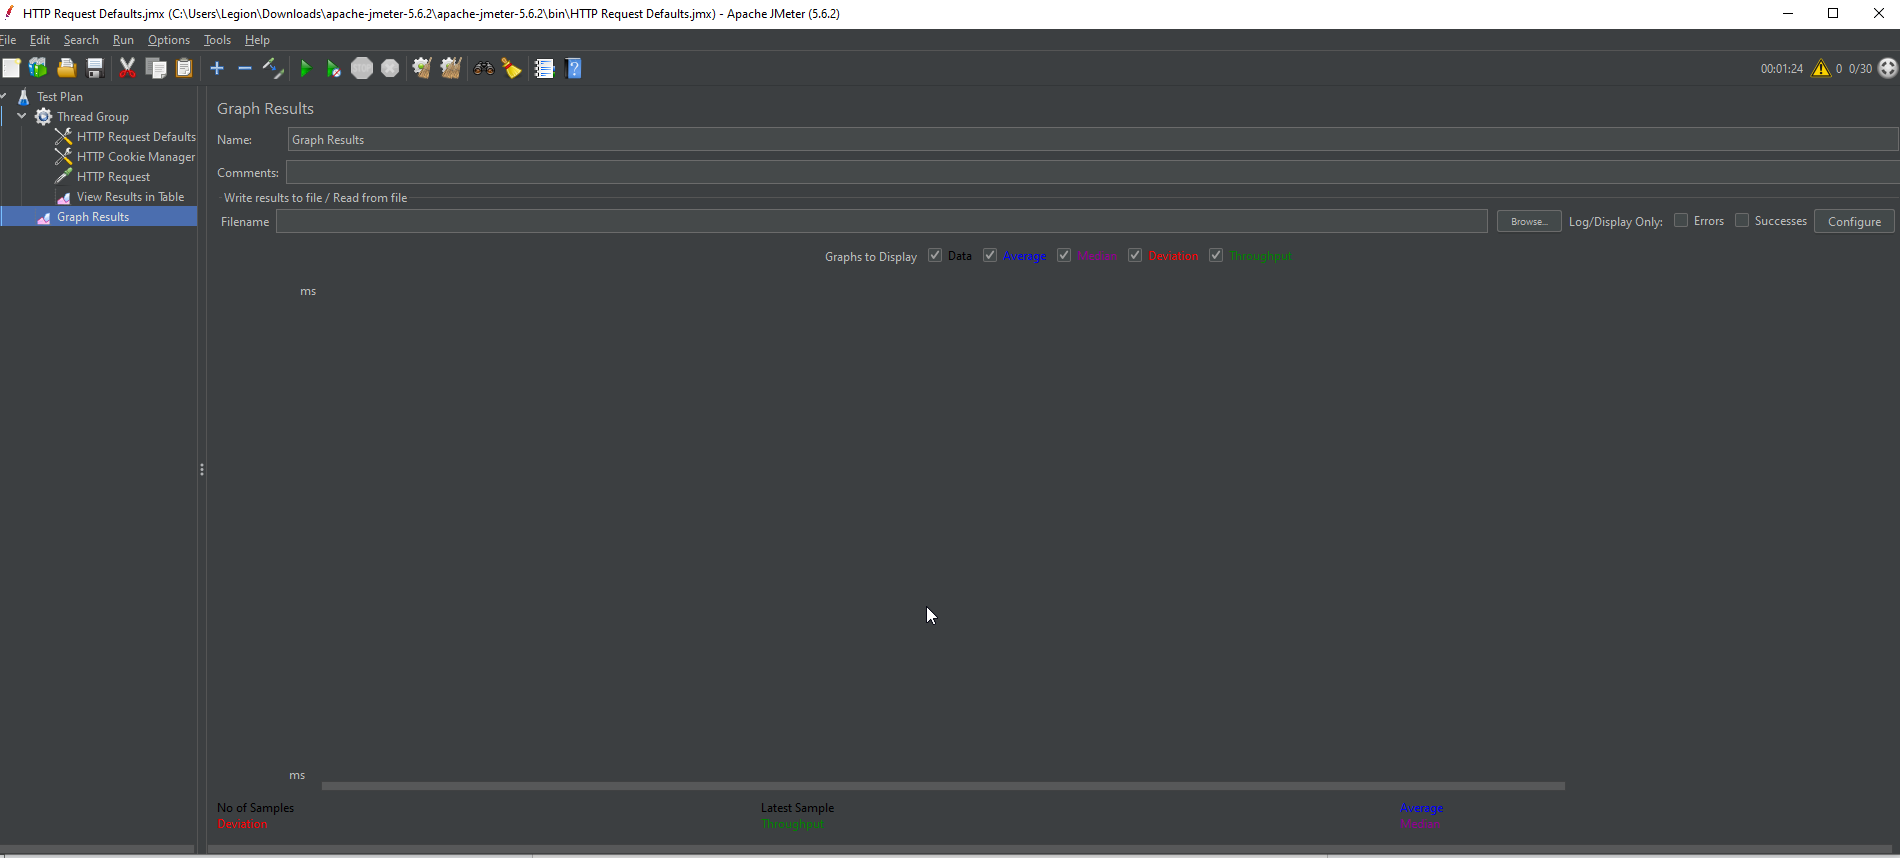
A new «Graph Results» parameter will appear in the tree on the left, and after clicking on it, the following window will be opened:
After running the test, the test plan graph will be displayed in this window. For the example above, this will be a graph showing 30 users visiting the site https://www.google.com/maps.
At the bottom of the graph, the following statistics are presented in colors:
- black: the total number of samplers sent;
- blue: the current average of all sent samplers;
- red: current standard deviation;
- green: throughput, which shows the number of requests per minute processed by the server.
To analyze the performance of the tested web server, you need to focus on 2 parameters:
- Throughput
- Deviation
Throughput is the most important parameter. It shows the ability of the server to handle a heavy load. The higher the throughput, the higher the server performance.
In this test, the Google service throughput is 861,322 per minute. This means that the Google server is capable of processing 861,322 requests per minute. This is quite a good result, so we can conclude that the Google server performs well. The Deviation parameter indicates the deviation from the average. The lower this value is, the better.
This way, by changing the parameters and types of settings, a variety of tests can be performed. For example, by increasing the number of threads, you can check how the server reacts under abnormally high load, for example, three times the standard peak load.
So, Jmeter is a quite popular open-source load testing tool that helps optimize and improve a web application server, resolve issues in settings, and increase its performance.


